SNG vs MTT Strategy: Bubble Pressure, Push/Fold and Stage-by-Stage Adjustments
SNG vs MTT strategy compared: bubble pressure, push/fold ranges and stage-by-stage adjustments, with cited sources and practical decision spots for both formats.
By the RiveraPoker editorial team. Educational analysis only; it is not personalised advice.
SNG vs MTT strategy comes down to one idea: the same cards get different correct answers because the prize structures differ. Two spots show the gap before any theory.
Spot one. You hold ace-jack offsuit on the button at 18 big blinds. A big stack shoves from the small blind. In a large MTT, this is a call on chips alone. In a single-table SNG on the bubble, it is usually a fold. PokerSkill frames the split directly.
Spot two. Same cards, different caller range. ICMIZER shows a 30bb chip-leader shove that the big blind calls with the top 43% of hands at chip EV, and only the top 20% under ICM.
Both spots show the direction of the shift. The research carries no worked ace-jack sit and go example, so treat the two answers above as illustrative.
The structures create those gaps. Here is the arithmetic behind them, in tables you can use at the table.
SNG vs MTT: the structural differences that change strategy
Field size, blind speed, payout shape and registration rules drive almost every SNG vs MTT strategy difference. A single-table SNG seats 9 or 10 players and pays three spots, conventionally 50/30/20. PokerStrategy and PokerSkill both describe that split as convention, so check your room’s payout table. Aaron Barone of 888poker, who played more than 287,000 sit and gos as a pro, puts the SNG bubble at four-handed in nine-max and three-handed in six-max.
| Structural factor | Single-table SNG (9-handed) | Large-field MTT |
|---|---|---|
| Field size | 9 or 10 | Hundreds to thousands |
| Places paid | 3 (50/30/20 convention; check the room’s table) | Varies by structure; there is no universal payout ratio |
| Bubble point | Four players left | When the money bubble nears |
| Blind levels | 10 to 15 minutes regular, about 5 for turbo, under 5 for hyper (PokerSkill) | 5-minute hyper-turbo up to 2-hour WSOP levels |
| Starting depth | Roughly 40 to 60bb (guides conflict, one puts 1,500-chip stacks nearer 75bb) | Deep: the 2026 WSOP Main Event starts at 60,000 chips with 100/200 blinds and a 200 ante, or 300bb (LegalUSPokerSites) |
| Registration | None. You sit down and the tournament closes | Late registration and re-entry; check the event’s structure sheet for the exact rules |
| Fees | Check your room’s rake schedule | House fees vary by event and are published on each structure sheet |
The WSOP comparison shows scale, and the same series contains events with very different structures. Check each event’s structure sheet before comparing a buy-in or a blind level.
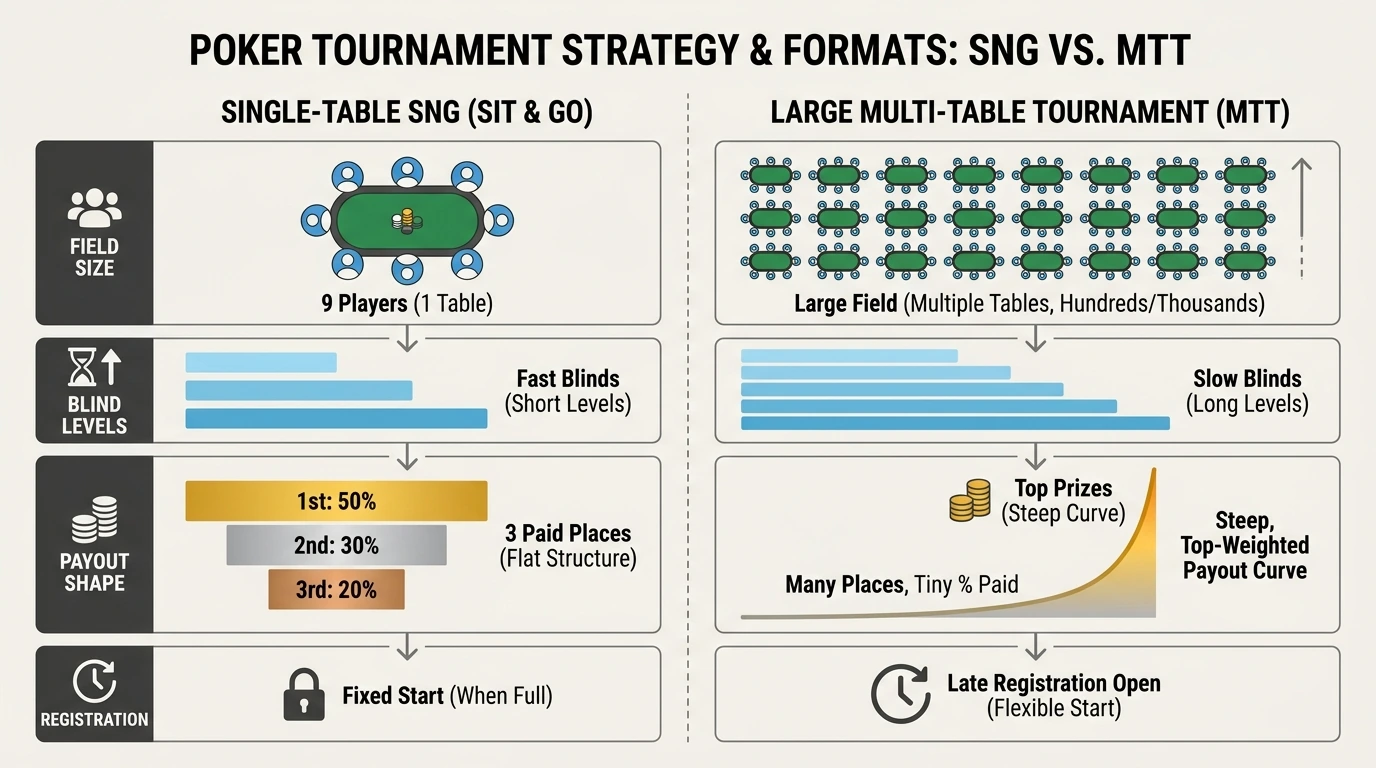
Where the money sits matters most. In BBZ Poker’s 9-player $10 SNG example, with a 50/30/20 payout, doubling your stack from 1,000 to 2,000 chips is worth $18.25 of a $100 prize pool rather than $20 (BBZ Poker). Chip value and prize value separate as a stack grows. GTO Wizard’s 10-player toy game shows the same effect through its bubble factor. That separation drives every bubble adjustment below.
SNG vs MTT: same spot, different answer
The correct action flips between formats when ICM pressure differs. The hand stays the same. Below are two decision spots and one ICM illustration. The ranges are illustrative round numbers from the cited sources, so treat the direction as the lesson and re-run the precise ranges in an ICM tool for your exact payout structure.
Spot 1: A 15bb shove from the button
SNG baseline: the charts point to a wide but structured shoving range, with the marginal bottom hands the first to go when players behind you cover you.
MTT baseline: shove wider once the bubble is far away. Before the bubble, antes alone justify more aggression.
Red Chip’s push/fold charts cover 5, 7, 10 and 15bb under a 9-handed 50/30/20 ICM model. The same chart set notes that model approximates large MTT bubbles well once about 60% of the field is gone, and you can play no-ICM before that point (Red Chip Poker). A sit and go push fold chart therefore works for the first 60% of an MTT, just with the ICM filter switched off.
Antes change the math in both formats. With 1,000/2,000 blinds and a 2,000 big-blind ante, a button raise to 4,400 breaks even when both blinds fold about 47% of the time instead of about 59% without the ante (PokerSkill). PokerSkill is an undated training page, so treat the exact percentages as directional. The direction is a large swing in steal profitability.
Spot 2: The bubble-factor math behind a short-stack call
SNG baseline (illustrative; not a solved AJo example): fold. Four players left means you can ladder into the money by folding.
MTT baseline (illustrative): depends on bubble factor. A call that wins chips can lose money in prize terms.
GTO Wizard’s formula makes the trade explicit: Required Equity = Bubble Factor / (Bubble Factor + 1). In a 10-player SNG toy game where the winner gains $84.44 of the $100 at risk, the bubble factor is 1.18, which implies about 54% required equity (GTO Wizard). Build a bigger stack of prize money above you, and the bubble factor climbs.
That is where the MTT and the SNG part ways. The same GTO Wizard source reports the Kill Everyone curve for a 10,000-runner Sunday Million: bubble factor near 1.6 on the money bubble and near 1.7 at the final-table bubble. Plug 1.6 into the formula and required equity becomes 1.6/2.6, or about 62%. Plug in 1.7 and it becomes 1.7/2.7, or about 63%. A 54% call in the SNG toy game becomes a call needing about 62% on the money bubble of a big field. Plenty of hands move from call to fold on that shift alone.
This is an ICM illustration rather than a direct SNG-versus-MTT comparison; the format flip comes from the prize structure above. ICMIZER’s five-handed example shows the same effect from the caller’s side: a chip leader’s 30bb shove gets called by the top 43% of the big blind’s range at chip EV, but only the top 20% under ICM (ICMIZER). Jonathan Little reports the mirror image for the raiser: a middle stack’s GTO raising range tightens from about 27% at chip EV to around 22% under ICM, and pot-odds calls need 10 to 15% extra equity near the final table (PokerCoaching).
Qualitative note: defending the big blind at 40bb
SNG baseline: the structure points toward defending tighter than the solver’s chip-EV output. In the conventional 50/30/20 single-table structure, cashing is a third of the field, and losing 10bb here costs you fold equity on the next orbit.
MTT baseline: the structure points toward defending near chip-EV ranges in the early and middle stages, then pulling back hard as the bubble approaches.
An SNG at 40 to 60bb starting stacks reaches the push/fold zone quickly with five-minute levels, so hands played at 40bb turn into shove decisions within a level or two (Smart Poker Study). The MTT player at the same depth may have hours of play before ICM pressure appears, which supports looser blind defense.
In a SNG, the bubble arrives early and stays, so every marginal spot carries a future cost. In an MTT, you get many chip-EV spots before ICM pressure lands.
These examples are illustrative calculations from the cited ranges; they are not advice for a specific hand or game.
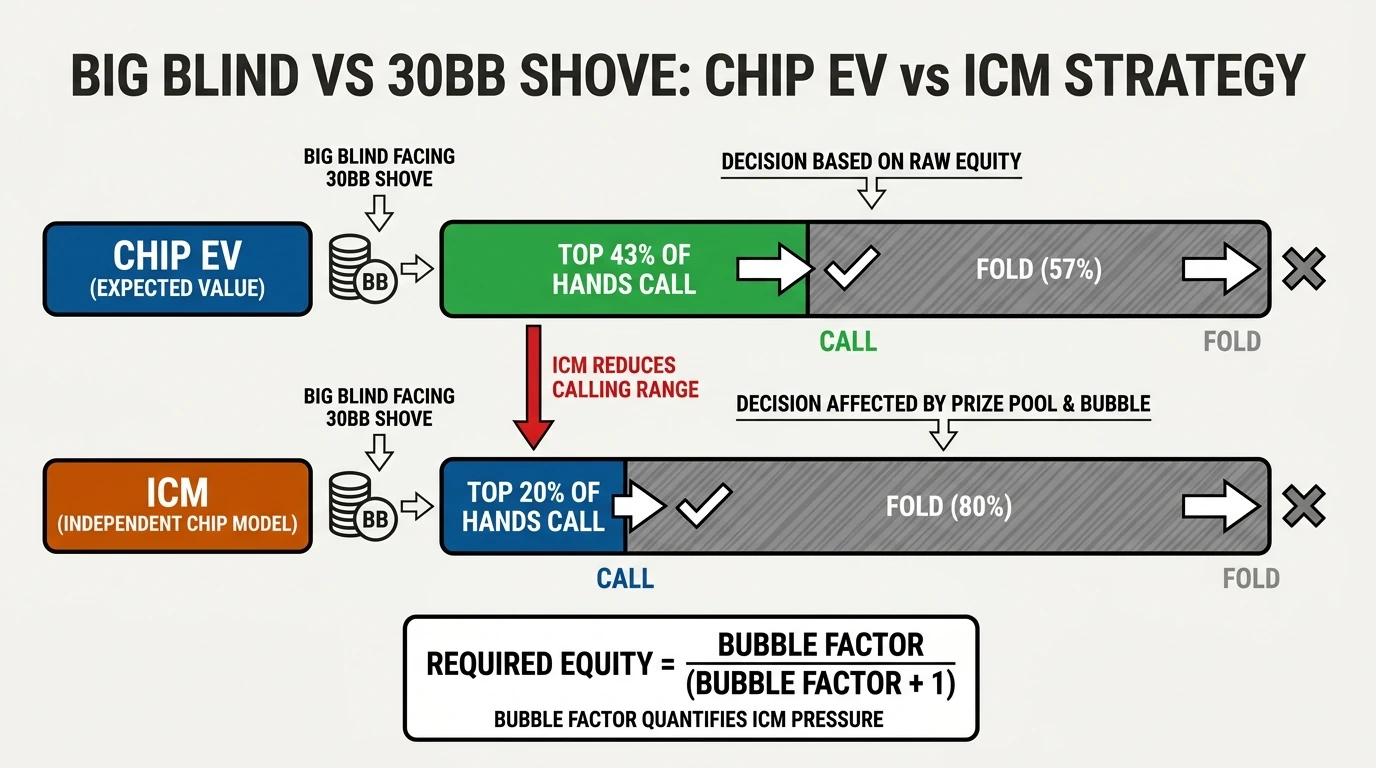
Photo: Michele Lana on Unsplash
SNG vs MTT strategy, stage by stage
Early play rewards patience in a SNG and volume in an MTT. Late play flips that. Here is the full grid.
| Stage | Single-table SNG | Large-field MTT |
|---|---|---|
| Early (40 to 60bb) | Play tight and simple. Five-minute levels leave no time to recover from a loose call. Small pots, low risk, no thin value bets | Deep stacks and 30-minute-plus levels allow speculative hands and postflop play. Work on early stage tournament strategy here, then convert to push/fold later |
| Middle (10 to 25bb) | Push/fold starts around 25bb facing a raise (PokerSkill). Charts drive almost every decision | Still deep relative to the blinds in a slow structure. Steals matter, but ICM pressure stays low until roughly 60% of the field is gone (Red Chip Poker) |
| Bubble | Four players left in nine-max. Fold hands that would be calls at chip EV. GTO Wizard’s 10-player toy game gives a 1.18 bubble factor, or about 54% required equity | Money bubble at bubble factor near 1.6 in a big field, where the formula asks for about 62% equity. Late registration also means stacks are still refilling |
| In the money | Three left, ladder jumps are small but immediate. Play is mostly about fold equity versus the two short stacks, covered further in our guide to in-the-money play | Min-cash has tiny value compared with the final table. Play returns closer to chip EV after the bubble, then tightens again near the final table |
| Final table | Played out inside a few minutes. Heads-up arrives fast | Our guide to final-table bubble play covers the adjustments, which matter most here. Bubble factor climbs toward 1.7 and stays high through pay jumps |
| Heads-up | Bubble factor returns to 1.0, so chip EV and prize EV match (GTO Wizard). Play the strongest range | Same rule, but the skill gap at the final table of a large field is usually bigger and stacks are deeper |
The bubble factor progression is the most transferable number in this table. GTO Wizard’s 10-player SNG toy game produces a peak of 1.18. On its 10,000-runner Sunday Million curve the money bubble sits near 1.6 and the final-table bubble near 1.7. Both lights return to 1.0 at heads-up.
SNG vs MTT variance and ROI: why headline return percentages are not comparable
Small field sizes and low per-game swings let a smaller edge compound with less ruin risk. The sourced data here covers MTT fields. For a 20% ROI player in 500-runner fields, per-tournament standard deviation is 7.2 buy-ins, which is 36 times the edge per game (Poker Academy). No comparable per-game standard deviation figure for single-table SNGs appears in this research.
ROI is profit divided by total investment including fees. PokerCoaching works through a 30% ROI example on that basis (PokerCoaching). The volatility around that average grows with field size.
| Metric | 500-runner MTT at 20% ROI |
|---|---|
| Standard deviation per tournament | 7.2 buy-ins, “36 times the edge” (Poker Academy) |
| Median worst downswing across 1,000 tournaments | 145 buy-ins, with 1 in 20 at 275 or more (same source) |
| 95% confidence interval on ROI after 500 tournaments | minus 140% to plus 180% (PrimeDope) |
| Reported downswings in 1,200-player fields | 125 buy-ins over 1,000 tournaments (PokerCoaching) |
Run these figures against your own plan and keep your results out of the prediction.
Three consequences follow.
A 30% MTT ROI may rest on a small sample. PrimeDope’s calculator shows a 95% confidence interval of minus 140% to plus 180% at 500 tournaments in big fields (PrimeDope). The interval shrinks as the sample grows, so a short run of deep finishes says little about your true win rate.
Downswings run long. PokerCoaching reports 125 buy-in downswings over 1,000 tournaments in 1,200-player fields (PokerCoaching). The Poker Academy simulation puts the median worst downswing at 145 buy-ins across 1,000 tournaments, with 1 in 20 at 275 or more (Poker Academy).
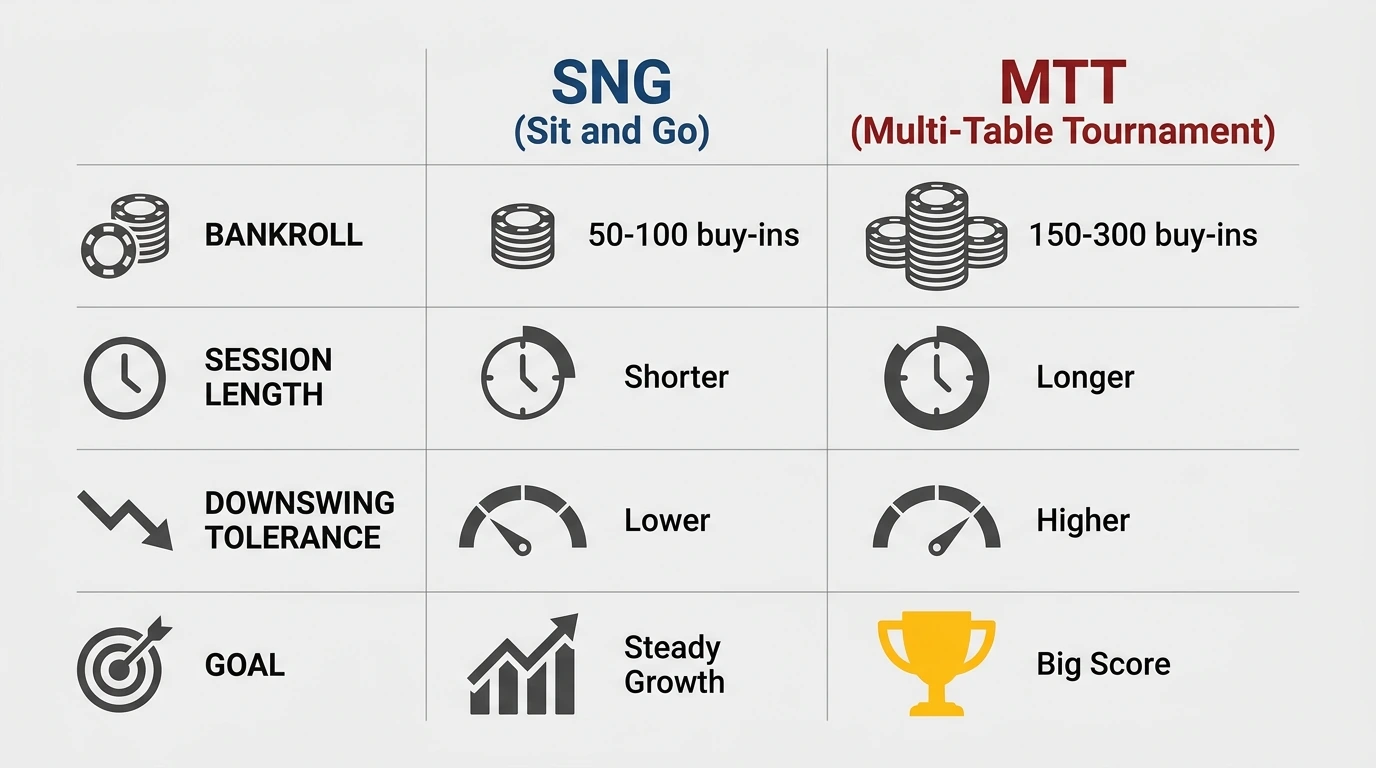
Bankroll needs differ by a multiple. Guidance runs 50 buy-ins minimum, 75 to 100 safer, for single-table SNGs, against 150 minimum and 200 to 300 for large-field MTTs (PokerBankrollApp). GTO Wizard suggests 75 to 125 buy-ins for tournament players generally (GTO Wizard).
Worked example. You have $1,000 and want to play $10 SNGs. That is 100 buy-ins, above the safer SNG band. The same $1,000 in $10 large-field MTTs is also 100 buy-ins, which sits below the 150-buy-in minimum. One bankroll covers the SNG plan and leaves large-field MTTs out of reach until you reach at least 150 buy-ins. The research gives no separate bankroll standard for small-field MTTs.
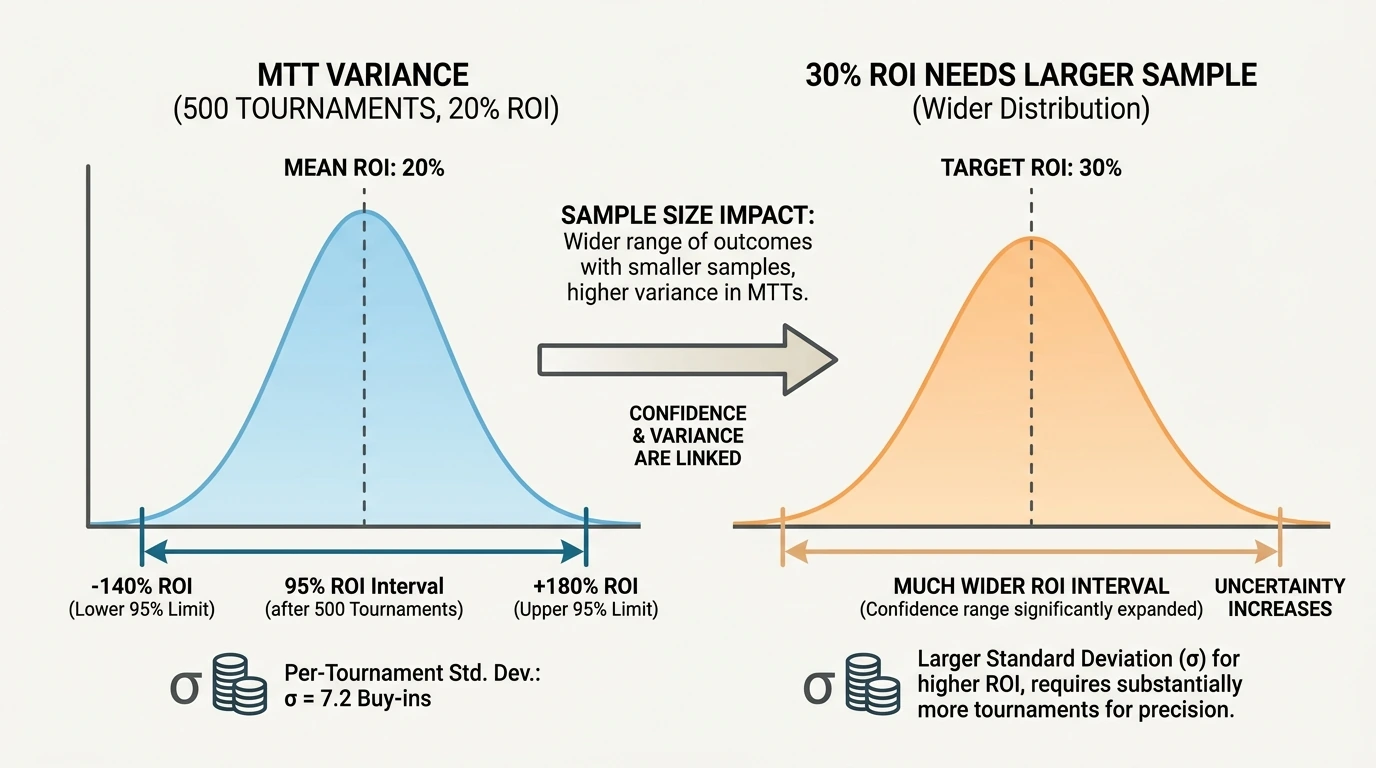
Photo: Gorilla ROI Data Connector on Unsplash
SNG vs MTT skill edge: where the soft money sits
Single-table SNGs punish leaks in push/fold and ICM discipline harder than MTTs do, because every leak appears in every tournament. An MTT lets a loose bubble call go unpunished for hours, then charges for it once a deep run arrives.
Consider one specific leak: calling too wide on the bubble. In a nine-handed SNG, the bubble is guaranteed to appear and it is unavoidable. One overcalling leak costs money in nearly every game. In a large-field MTT, the deep bubble states arrive only in the rare tournament where you survive long enough to reach them. The same player meanwhile gets many early chip-EV spots where loose calling is fine.
That asymmetry makes SNG a cleaner training ground. The volume of repeatable spots per hour is higher, and the feedback loop is short.
Game selection differs too. SNG fields are small and relatively stable, so the edge comes from table-level reads and precise shove ranges. MTT fields are large, so the edge comes from surviving long enough to reach the stages where most opponents make ICM errors.
SNG vs MTT: how to weigh which format fits
Five factors separate the two formats for most players: bankroll, session length, study time, tolerance for downswings and goal. The sourced guidance covers bankroll and variance. The hours and study notes follow from the structures above. These are educational criteria for comparing the formats; they are not a recommendation to play either.
- Bankroll in buy-ins at your chosen stake. PokerBankrollApp puts single-table SNGs at 50 buy-ins minimum, with 75 to 100 safer, and large-field MTTs at 150 minimum, with 200 to 300 for comfort (PokerBankrollApp). A roll of 100 buy-ins covers SNGs with room to spare and sits below the large-field MTT band. Small-field MTTs fall between the two sets of figures, and the research gives no separate standard for them.
- Hours per session. A regular SNG runs its 10 to 15 minute levels from a 40 to 60bb stack and wraps in well under two hours. A slow-structure MTT carries 30 to 60 minute levels, and major-series Day 1 levels can run longer, so its sessions run long. Short sessions are a structural fit for SNGs and hyper-turbos; long blocks are a structural fit for slow MTTs.
- Study hours per week. Red Chip’s charts cover 5, 7, 10 and 15bb and apply directly to a full-table SNG, so a small study budget goes a long way in SNGs (Red Chip Poker). MTTs add deep-stack postflop play, bubble dynamics and final-table ICM, so they demand more study time.
- Tolerance for downswings. A 500-runner MTT field carries a per-tournament standard deviation of 7.2 buy-ins at a 20% ROI, with a median worst downswing of 145 buy-ins across 1,000 tournaments (Poker Academy). A player who prefers to stop after a 100 buy-in drawdown may find SNGs the better structural fit.
- Goal. Steady growth fits SNGs, where a single table pays three spots in the conventional structure and pay jumps arrive quickly. Chasing a large first prize fits MTTs, where the prize pool is spread across a larger field; check each structure sheet for the actual payout shape. The MTT sample figures above show how long it takes for results to separate skill from variance.
Whichever format you pick, the next step is learning where the biggest edges sit in the stage you are in. Our ICM and bubble pressure explainer covers bubble factor and required-equity math in more detail, and the MTT and SNG stage guides break down ranges for each stage in the table above.
Frequently asked questions
Is a SNG or an MTT better for a small bankroll? Single-table SNGs suit a small bankroll. Guidance runs 50 buy-ins minimum for SNGs, with 75 to 100 safer, against 150 minimum and 200 to 300 for large-field MTTs (PokerBankrollApp). GTO Wizard puts tournament players broadly at 75 to 125 buy-ins (GTO Wizard). The bands suggest SNGs suit a bankroll under 150 buy-ins, while large-field MTTs need at least the 150-buy-in minimum; treat this as education rather than a recommendation.
How many buy-ins do I need for SNGs vs MTTs? 50 at a minimum, 75 to 100 for safety in SNGs. For large-field MTTs, 150 minimum and 200 to 300 for comfort. The gap reflects variance: a 500-runner MTT field carries a per-tournament standard deviation of 7.2 buy-ins (Poker Academy).
How many big blinds before shoving in a sit and go? Red Chip’s charts cover 5, 7, 10 and 15bb under a 9-handed 50/30/20 model (Red Chip Poker). PokerSkill puts the push-or-fold line near 25bb when facing a raise; it is an undated training page, so treat the exact line as directional (PokerSkill). Above the deepest chart, the correct shove range depends on your exact payout structure, so run it in an ICM tool.
How many games do I need to know my true ROI? More than most players expect. At 500 tournaments in 500-runner fields, the 95% interval can span minus 140% to plus 180% (PrimeDope). No SNG-specific convergence figure appears in this research, so the MTT intervals above remain the only sourced sample guidance here.
What is a normal downswing in MTTs? PokerCoaching reports 125 buy-in downswings over 1,000 tournaments in 1,200-player fields (PokerCoaching). A 500-runner simulation puts the median worst downswing at 145 buy-ins (Poker Academy).
Do ICM considerations apply in single-table SNGs? Yes. Red Chip’s charts use a nine-handed 50/30/20 model as the SNG case (Red Chip Poker), and GTO Wizard’s 10-player SNG toy game produces a 1.18 bubble factor (GTO Wizard).
Does ICM matter heads-up? No. GTO Wizard’s bubble-factor curve returns to 1.0 heads-up, because no player is left to ladder past (GTO Wizard). Chip EV and prize EV match, so play the strongest range.
Why can a 30% MTT ROI be less reliable than a 10% SNG ROI? Per-game swings are larger in big-field MTTs, so a 30% ROI can rest on a handful of deep runs. The 95% interval at 500 big-field tournaments still spans minus 140% to plus 180% (PrimeDope). A smaller edge across many lower-variance games can build a bankroll with less ruin risk at the same dollar stake. This research carries no SNG-specific standard deviation figure, so treat that comparison as a direction rather than a measured result.

Written by
Jake Rivera
Poker writer
Jake Rivera writes about poker strategy across No-Limit Hold'em, Pot-Limit Omaha and Short Deck. His work covers preflop ranges, ICM and bubble decisions, and postflop lines, along with the adjustments that separate tournament play from cash games.